
Figure 3.
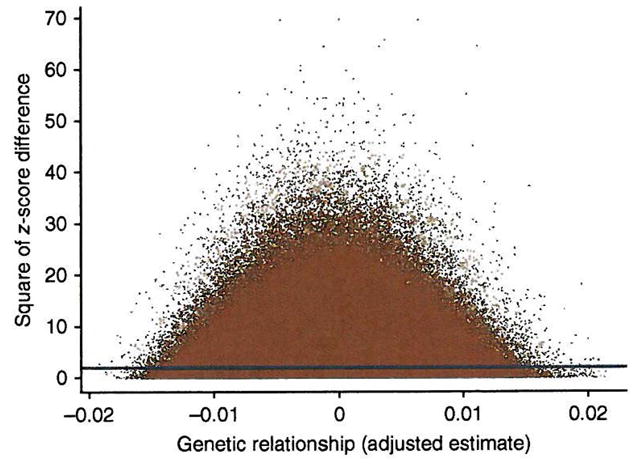
All pairwise comparisons contribute to the estimate of genetic variance. Shown are the squared z-score differences between individuals ( ) plotted against the adjusted estimates of genetic relationship ( ). The blue line is the linear regression line of on . The intercept and regression coefficient are estimates of twice the phenotypic variance and minus twice the genetic variances23, respectively. The intercept is 1.98 (s.e. = 0.001) and the regression coefficient is −1.01 (s.e = 0.27), consistent with estimates of the phenotypic and additive genetic variance of 0.990 and 0.505, respectively, and a proportion of variance explained by all SNPs of 0.51.