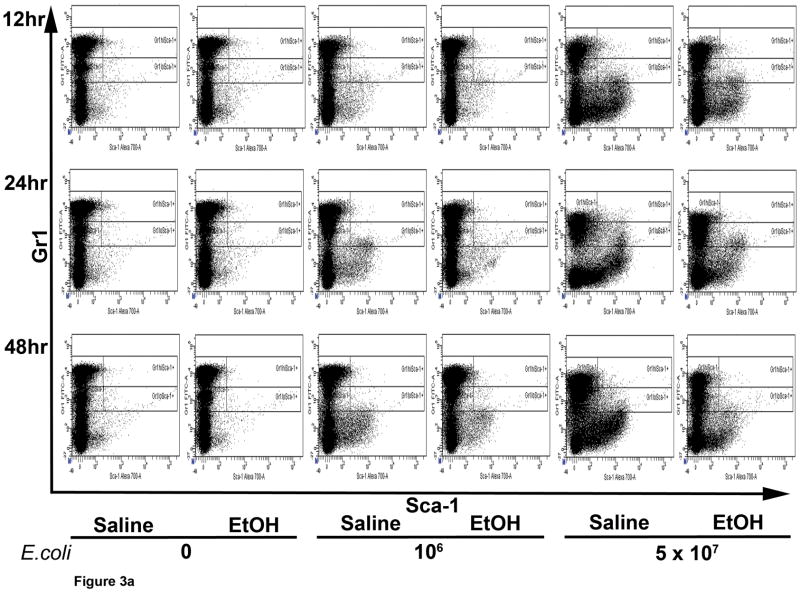
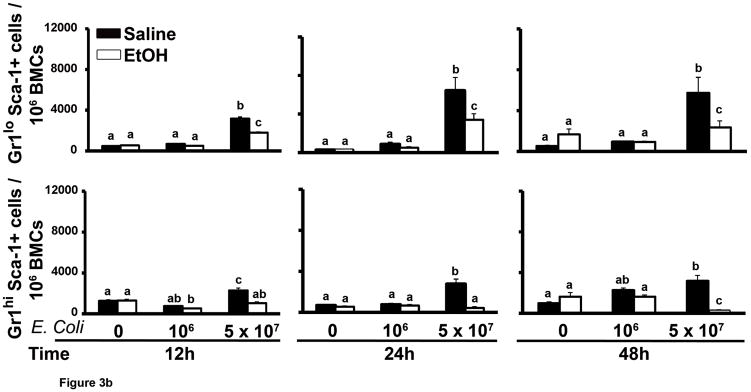
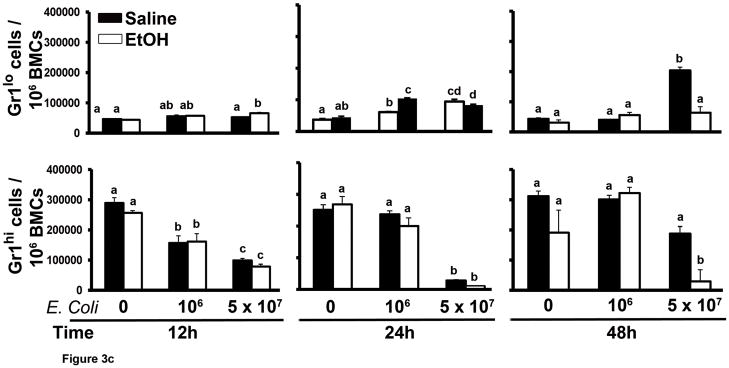
Figure 3.
The marrow Gr1+Sca-1+ cell response to septicemia. (A) Representative dot plots of AF700-Sca-1 (x axis) and FITC-Gr1 (y axis) expression by bone marrow cells during septicemia. Gated populations include Gr1hiSca-1−, Gr1loSca-1−, Gr1hiSca-1+, and Gr1loSca-1+ cells. (B and C) Quantification of the results. Data are mean ± SEM (N=5–8). Bars with different letters are statistically different (p < 0.05).


