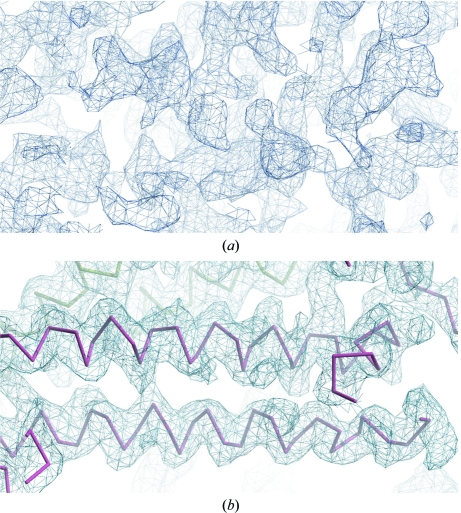
Figure 3.
(a) Experimental electron-density map of one section of the asymmetric unit after initial phasing using AutoSol within PHENIX. (b) The same section after density modification, with the partially traced main chains shown in red and green (symmetry-related molecule). Both maps were produced in Coot (Emsley & Cowtan, 2004 ▶) and contoured at 1.0σ.

