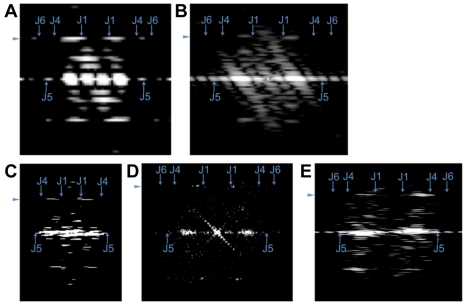
Figure 5. BtubA/B tubes have a helical, microtubule-like lattice.
(A) Fourier transform of a simulated projection image (1.2 nm/pixel) of a five-protofilament BtubA/B-tube model (Figure 4) with a helical, microtubule-like lattice. A prominent pair of elongated spots on the subunit-repeat layer line on either side of the meridian corresponds to the helical family J1. Pairs of spots for the helical families J4 and J6 were very weak, likely because of destructive interference with the first minimum of the J1 Bessel-function. The subunit-repeat layer line was surprisingly asymmetric probably because of the small number of protofilaments and the resulting lack of an extended “front” and ”back” side. The asymmetry also shifted around the meridian depending on the rotation of the tube around its length axis (Figure S10). (B–E) Fourier transforms of BtubA/B-tubes in (B) a 2-D slice through a subtomogram average (from within a P. vanneervenii cell), (C) a negatively stained projection image (of an in vitro assembled tube), (D) a cryo-EM projection image (of an in vitro assembled tube), and (E) a 2-D tomographic slice containing an in vitro assembled tube. The prominent pair of J1 spots on the subunit repeat layer line in all cases suggests a helical lattice, as all non-helical models lead to high-intensity spots on the meridian (unpublished data). Arrowheads indicate the subunit repeat layer line. Arrows mark the maxima of the J1, J4, J5, and J6 Bessel-functions, assuming outer rather than mass-weighted radii (and therefore marking the expected meridional borders of spots).

