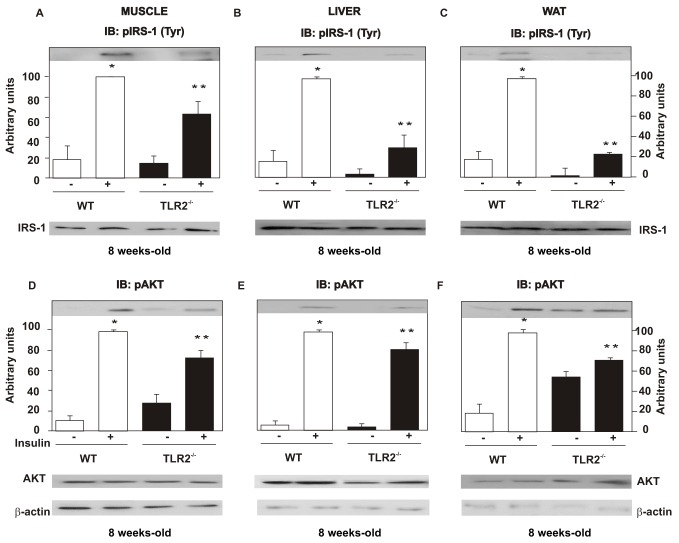
Figure 5. TLR2 knockout (TLR2−/−) mice present decreased insulin signaling.
Tyrosine 941 phosphorylation of the insulin receptor substrate (IRS)-1 in muscle (A), liver (B), and WAT (C). Serine phosphorylation of AKT in muscle (D), liver (E), and WAT (F). IRS-1 and AKT protein expression in muscle, liver, and white adipose tissue (A–F, lower panels). Equal protein loading in the gel was confirmed by reblotting the membrane with an anti-β-actin antibody (lower panels). All evaluations were made with mice on standard chow. Data are presented as means ± S.E.M from six to eight mice per group from experiments that were repeated at least three times. *p<0.05 between WT with and without insulin stimulus; ** p<0.05 between TLR2−/− mice and their controls with insulin stimulus.

