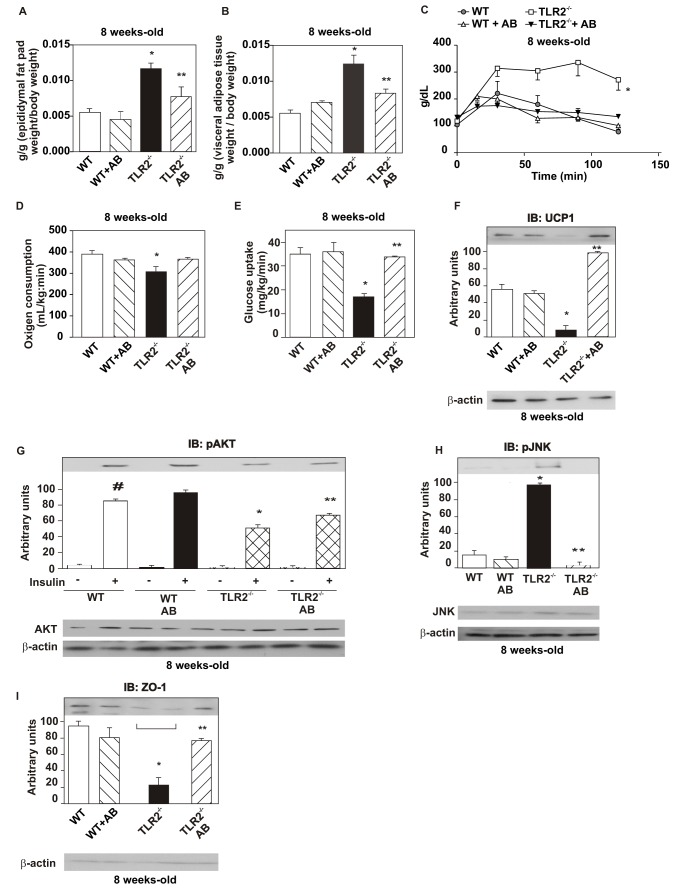
Figure 7. Alterations in the metabolic parameters and in insulin signaling and sensitivity after treatment with antibiotics.
(A) Epididymal fat pad weight. (B) Visceral adipose tissue weight. (C) Glucose tolerance test. (D) Oxygen consumption. (E) Glucose uptake obtained by the euglycaemic hyperinsulinaemic clamp. (F) UCP-1 expression in the brown adipose tissue. (G) Serine phosphorylation of AKT after the treatment with AB. (H) Phosphorylation of JNK after the treatment with AB. (I) Zonula occludens (ZO)-1 expression in the ileum. Equal protein loading in the gel was confirmed by reblotting the membrane with an anti-β-actin antibody (lower panels). Data are presented as means ± S.E.M from six to eight mice per group, from experiments that were repeated at least three times. All evaluations were made with mice on standard chow. # p<0.05 between WT mice with or without insulin stimulus; * p<0.05 between WT and TLR2−/− mice with insulin stimulus; ** p<0.05 between TLR2−/− and TLR2−/− treated with AB, with insulin stimulus.

