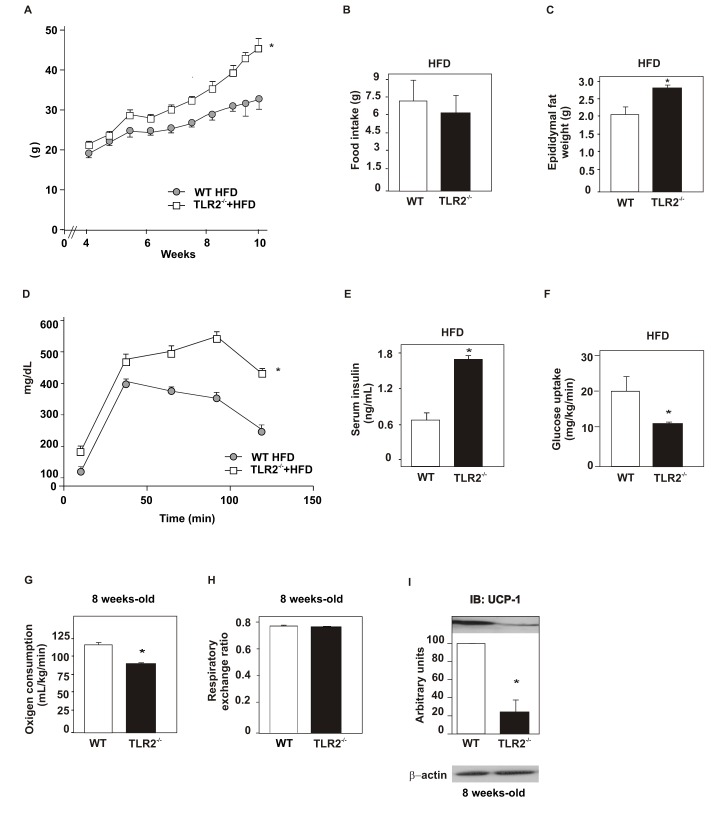
Figure 9. Metabolic parameters of TLR2 KO (TLR2−/−) mice fed a high-fat diet.
(A) Weight gain after 10 wk of high-fat diet (HFD). (B) Food intake. (C) Epididymal fat pad weight. (D) Glucose tolerance test. (E) Serum insulin concentration. (F) Glucose uptake obtained from the euglycaemic hyperinsulinaemic clamp. (G) Oxygen consumption and (H) respiratory exchange rate. (I) UCP-1 expression in the brown adipose tissue. Data are presented as means ± S.E.M from six to eight mice per group from experiments that were repeated at least three times. All evaluations were made with mice on standard chow. * p<0.05 between TLR2−/− mice and their controls.

