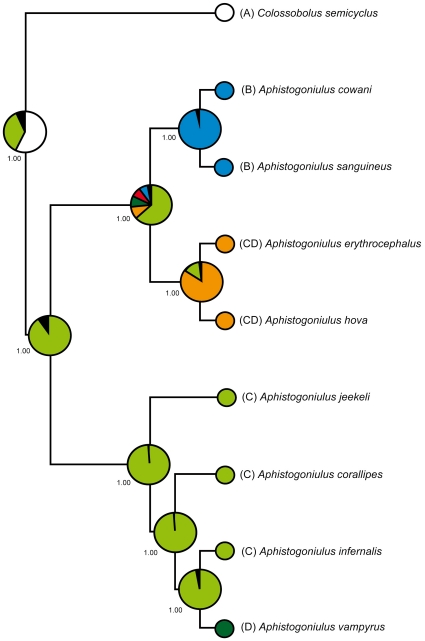
Figure 5. Graphical results of the ancestral habitats for the given molecular phylogeny of Aphistogoniulus using RASP.
Pie charts at internal nodes show calculated probabilities of alternative ancestral habitats (detailed information are given in Supplementary Information S8; see also material and methods). Habitat color code: seasonal dry forest (A) = white, montane rainforest (B) = dark blue, lowland rainforest (C) = light green, mid elevation rain forests (D) = dark green, mixture of B and C = red, and a mixture of C and D = orange. Black sections indicate habitats with probabilities <5%. Numbers at nodes indicate estimated p values.

