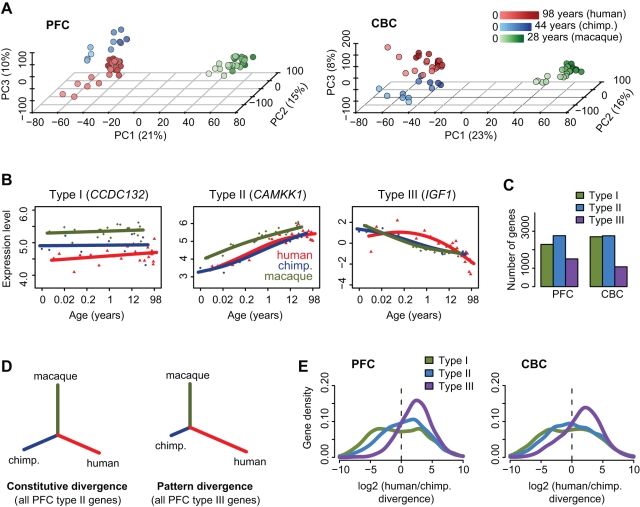
Figure 1. Gene expression variation in the PFC and CBC.
(A) Principle components of the two brain regions' transcriptomes based on all expressed genes (CBC:12,853; PFC:12,447). Each individual is represented by a circle; colors represent species (red, human; blue, chimpanzee; green, macaque), and lighter shades indicate younger age. The proportion of variance explained by each component is shown in the axes labels. In both regions, the first component corresponds to macaque-hominid divergence, the second to age differences, while the third component (z-axis) separates humans and chimpanzees. (B) Examples of the three types of divergence in the PFC dataset. Each point represents an individual (red, human; blue, chimpanzee; green, macaque), while lines show cubic spline curves. The x-axis shows individuals' age in log2 scale. Gene names are shown on top of each panel. (C) Numbers of genes assigned to the three divergence types (Table S2). (D) Example neighbor-joining (NJ) representing constitutive and pattern divergence, based on expression profiles of PFC type II and type III genes. Trees were constructed per gene, using Euclidean distances between expression-age trajectories between each pair of species (Text S1). The figure reflects the mean divergence per gene set. (E) Distributions of log2-transformed human-chimpanzee branch ratios estimated from NJ trees across gene sets. Ratios <|10| are only shown for illustrative purposes. See Table S3 for additional analyses on the distributions.

