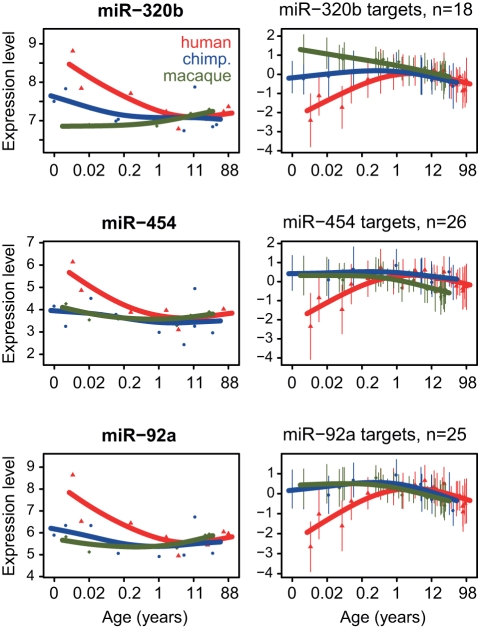
Figure 4. Examples of candidate regulators of PFC developmental remodeling (left panels) and their predicted and negatively correlated targets (right panels).
The three miRNAs were chosen based on predicted target enrichment among type III genes and an excess of negative correlations with predicted targets, using both expression profiles and species differences (Text S1, Table S8). Each point represents an individual (red, human; blue, chimpanzee; green, macaque), and lines show cubic spline curves. The x-axis shows individuals' age in log2 scale. In the target profile plots, the y-axis shows the mean standardized expression level among target genes, while error bars indicate one standard deviation from the mean.

