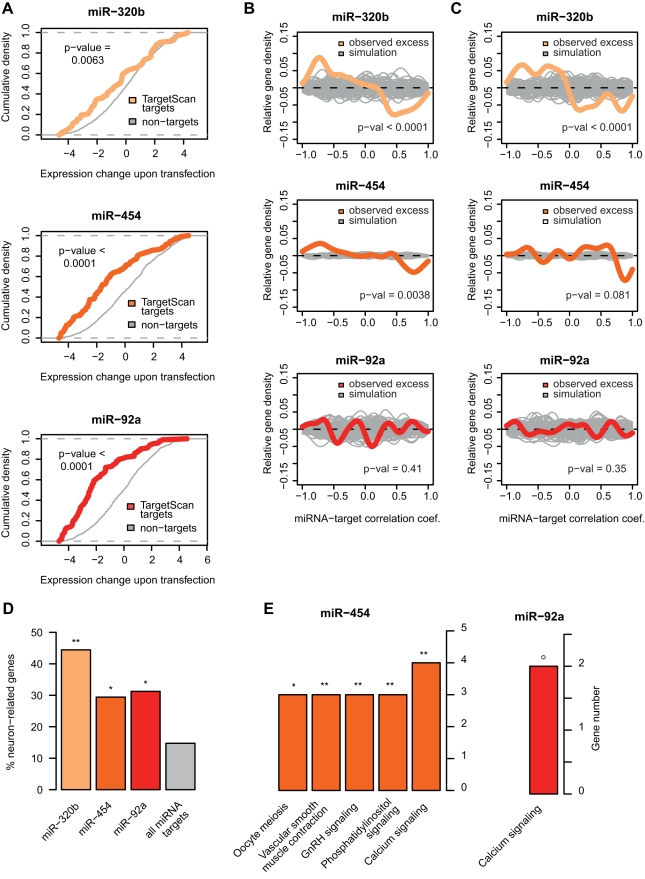
Figure 5. Regulatory effects of miRNA tested in cell lines.
(A) Gene expression shifts in miRNA-transfected cell lines. The colored and grey lines show the cumulative density (y-axis) of the expression change magnitude upon transfection (x-axis), for target genes predicted by TargetScan among PFC type III genes, and all other type III genes, respectively. The x-axis is calculated as the expression level difference between miRNA-transfected and negative control-transfected neuroblastoma cell lines, per gene (Materials and Methods). The p values were calculated by one-sided Wilcoxon tests. (B) Excess of negative correlations between miRNAs and their targets identified based on inhibition in the cell line experiments. The colored line shows the distribution of correlations between miRNA-target pairs relative to miRNAs-non-target pairs (observed excess). The grey lines depict the random expectation estimated by 100 permutations of miRNA-non-target pairs. This analysis does not include information from TargetScan predictions. The p values were calculated by one-sided Wilcoxon tests. (C) Same as panel C, but using species differences (across expression-age trajectories) to calculate regulator-target correlations. Panels B–C are analogous to Figure 3E–F. (D) Proportion of neuron-related genes, based on Gene Ontology [14], among the three miRNAs' verified gene sets. The fourth column indicates the proportion of neuron-related genes among all PFC-expressed miRNA target genes, which was used as background in the enrichment tests. ** p<0.01, * p<0.05, ° p<0.10; based on one-sided Wilcoxon tests. (E) KEGG pathways enriched among verified targets of miR-454 and miR-92a. ** p<0.01, * p<0.05, ° p<0.10; based on one-sided hypergeometric tests, Bonferroni-corrected.

