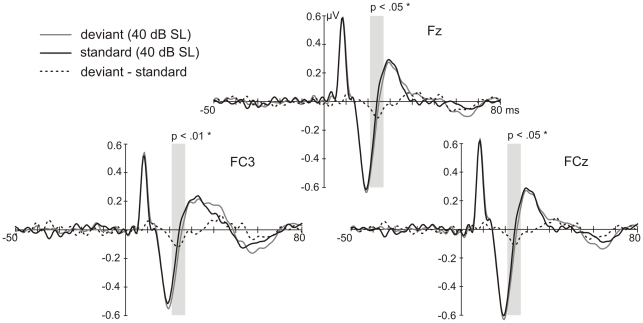
Figure 5. Deviance-related changes in the MLR.
Grand-average response (N = 23) at FCz, FC3 and Fz elicited by deviants and standards. The grey shaded fields mark the time window of the mean amplitudes used for statistics. The difference waveforms reveal a negative displacement of the response to deviants compared to the one to standards.

