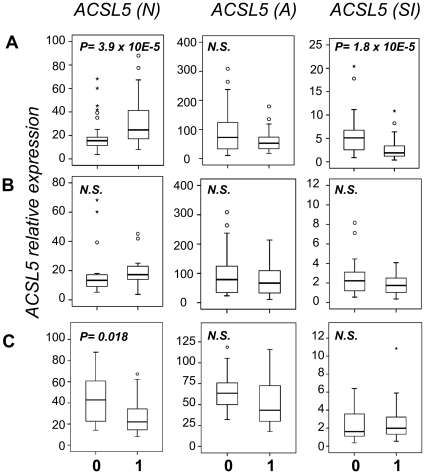
Figure 1. Association of ACSL5 mRNA expression levels with SLE.
A) ACSL5 transcript levels in PBMCs from healthy controls (0) and SLE patients (1) for ACSL5(N) (number of samples n: 0 = 49, 1 = 45), activated ACSL5(A) (n, 0 = 34, 1 = 40) and the ratio A/N (ACSL5(SI) (n, 0 = 34, 1 = 40). B) ACSL5 transcript levels in PBMCs from males (0) (n = 24) and females (1) (n = 25), all of them from the control group. C) ACSL5 transcript levels in PBMCs from prednisone treated (1) (n = 28) and untreated (0) (n = 12) SLE patients. Results are represented in box plots given medians, quartiles, outsiders (circle points) and extremes (asterisk points). P-values of differences between the groups (0) and (1) are defined by Mann-Whitney Statistics. N.S. stands for non significant.

