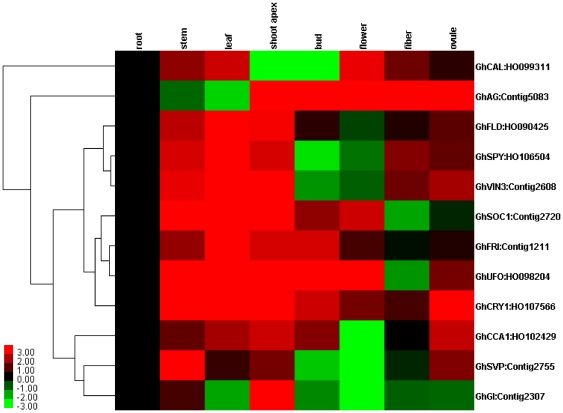
Figure 4. Tissue expression patterns of 12 putative flowering genes from upland cotton.
qRT-PCR was used to evaluate the relative levels of flowering-related ESTs in different tissues (root, stem, leaf, shoot apex, bud, flower, fiber, and ovule) with endogenous 18S and root samples used for reference. The patterns were clustered and viewed using Gene Cluster and TreeView software (Stanford University).

