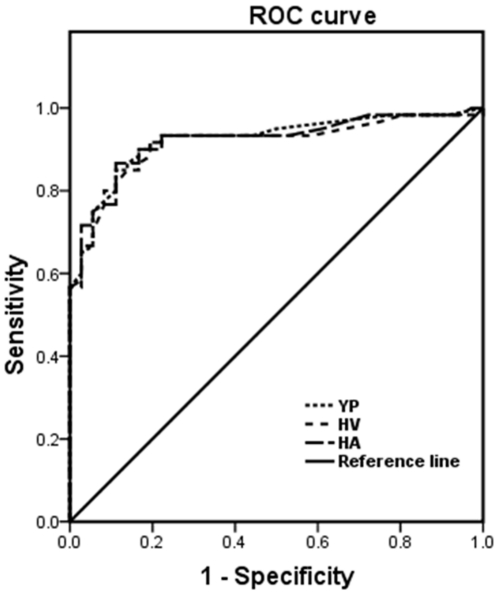
Figure 4. ROC curve for detection of BRV of the phage-mediated ELISA in comparison to the qPCR.
The ROC (receiver operating characteristics) analysis for all samples to each phage detection (YP, HV or HA) was performed, respectively according to the area under the ROC curves (AUC). The results of the qPCR analysis of these samples were used as “gold standard” reference. The ROC plots the true positive rate (sensitivity) against the false positive rate (1-specificity). The diagonal indicates no discriminatory power.

