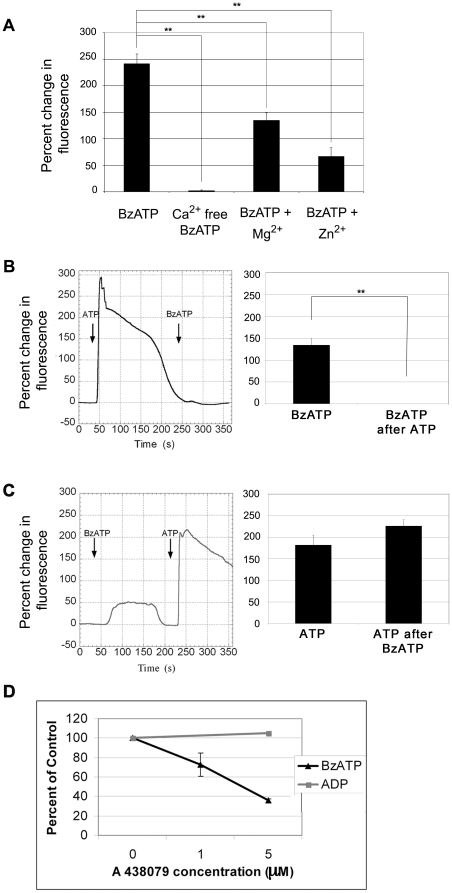
Figure 1. BzATP causes an increase in intracellular Ca2+.
HCLE cells were incubated in 5 µM fluo-3AM for 30 min and imaged in a flow-through apparatus on a Zeiss LSM 510 confocal microscope. Cells were washed with indicated HEPES-buffered saline (control, Ca2+ free, 4 mM Mg2+, 100 µM ZnSO4) and stimulated with BzATP in corresponding buffer for 2 min. Maximal percent change in average fluorescence of a 460 µm×460 µm field was determined. A. HCLE cells stimulated with BzATP in HEPES buffer, in Ca2+ free - HEPES buffer, in HEPES buffer with Mg2+ and in HEPES buffer with Zn2+. Graphs represent a minimum of six independent experiments +/− SEM. Analysis of variance was determined using the general linear model procedure followed by Tukey-Kramer posthoc test. **p<0.001. B. Response of HCLE cells to ATP followed by stimulation with BzATP. Representative trace of changes in fluorescence over time. Graph represents difference between stimulation with ATP and BzATP after ATP and represents a minimum of six independent experiments +/− SEM. Students t-test ** p<0.001. C Response of HCLE cells to BzATP followed by ATP. Representative trace of changes in fluoresence over time. Graph represents difference between stimulation with BzATP and ATP after BzATP and represents a minimum of six independent experiments +/− SEM. D. Cells were washed with HEPES buffered saline with the indicated concentrations of A438079 and stimulated with BzATP or equimolar concentrations of ADP for 2 min in the presence or absence of inhibitor. The average maximum percent change in fluorescence is graphed as a percentage of the uninhibited control +/− SEM. Each time point is an average of 12 independent experiments. Linear regression analysis where the slope of the line for BzATP is significantly different from 0. p = 0.0001. The control ADP is not significantly different from 0.

