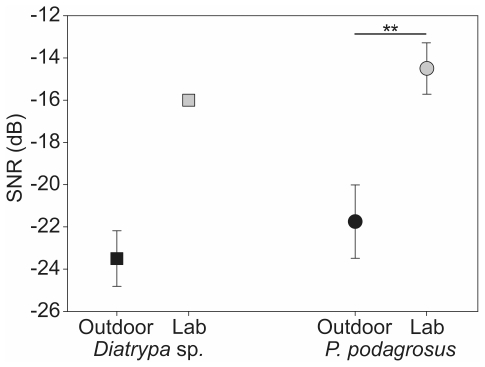
Figure 3. Results of spatial release from masking experiments in the laboratory (P. podagrosus).
Comparison of SNRs at masked thresholds with masker M1/M2 (black squares; N = 12) and M3 (grey squares; N = 6) for ipsilateral (masker and signal presented from the same side of the recorded AN1) and contralateral masker position (masker spatially separated by 180°).

