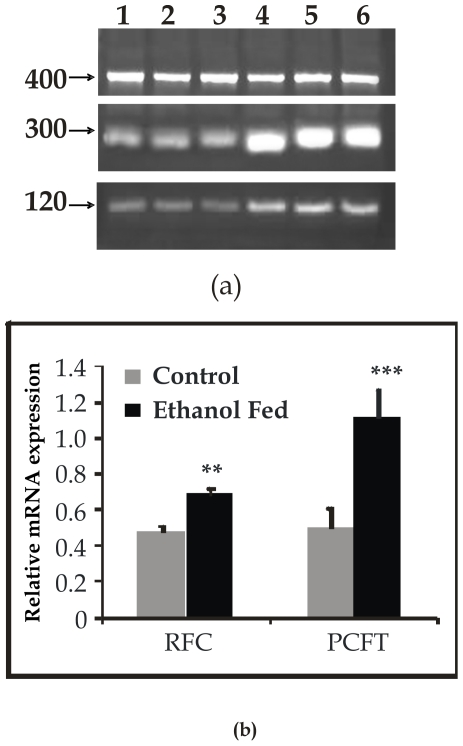
Figure 4. RT-PCR analysis of RFC (120 bp) and PCFT (300 bp) with GAPDH (400 bp) as an internal control in pancreas.
(a) Resolved on 1.2% agarose gel electrophoresis and (b) densitometric analysis representing relative change in PCFT and RFC mRNA expression. Data shown are representative of 5 separate sets of experiments. Lanes 1-4: Control; 5–8: Ethanol fed. **p<0.01, ***p<0.001 vs. Control.

