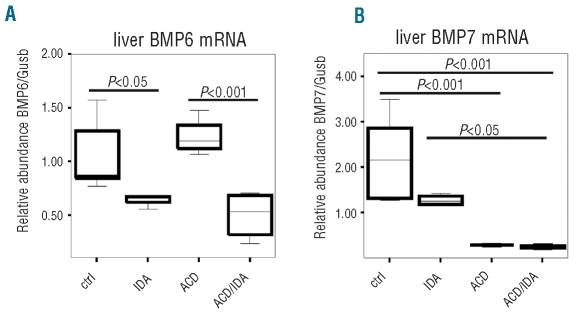
Figure 2.
Liver BMP mRNA expression in different anemia groups. ACD was induced by i.p. injection of PG-APS (n=6) as detailed in the Design and Methods section; controls received solvent injections (n=6). One group of PG-APS treated (n=6) and one of solvent treated (n=6) rats were phlebotomized, starting one week before sacrifice, to create a combination of ACD and iron deficiency anemia (ACD/IDA) or IDA alone, respectively. BMP 6 and 7 mRNA (A and B) expression was determined by quantitative RT-PCR and normalized to the mRNA expression level of the housekeeping gene β-glucoronidase (Gusb) (A and B). Data are depicted as lower quartile, median and upper quartile (boxes) and minimum/maximum ranges (whiskers). Calculations for statistical differences between the various groups were carried out by ANOVA technique and Bonferroni’s correction for multiple tests.

