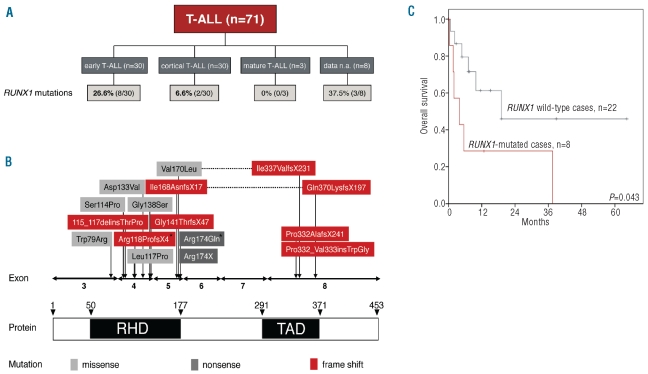
Figure 1.
(A) Distribution of RUNX1 mutations between the three subgroups of T-ALL. (B) Distribution of RUNX1 mutations in ALL. Location of the 17 mutations in RUNX1 according to the functional domains as detected in 15 patients. Vertical arrows indicate the location of the mutations; corresponding concurrent mutation pairs of the same patient are connected by horizontal lines. Two mutations marked with an asterisk indicate the 2 B-ALL cases. (C) Kaplan–Meier overall survival estimates including 30 early T-ALL cases. Data are shown for overall survival of T-ALL patients separated into two groups of RUNX1-mutated (n=8) and RUNX1 wild-type patients (n=22; alive at two years 28.6% vs. 46.0%).

