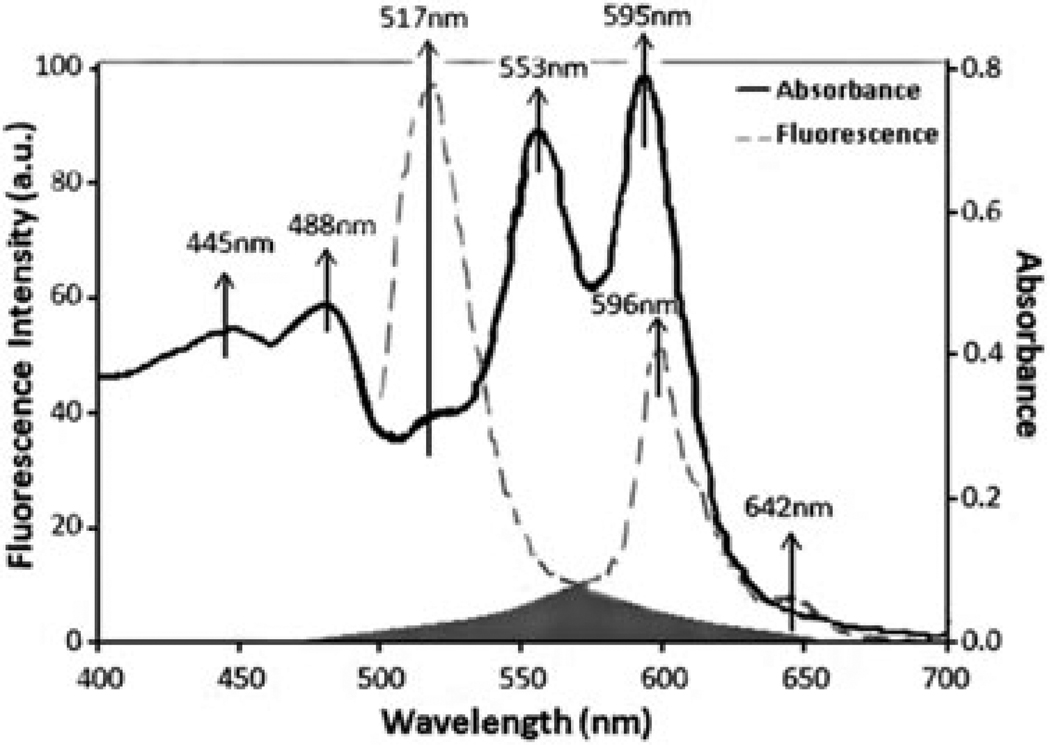
Fig. 3.
Spectral analysis of the dual-marked A549 cells with CFSE and PVP-Hypericin. The black solid line shows the absorbance spectrum, and the grey dashed line indicates the fluorescence emission spectrum at 488 nm excitation wavelength. The broad fluorescence emission spectra of CFSE (around 517 nm) and of PVP-Hypericin (around 596 nm) exhibit considerable overlap in the grey area.

