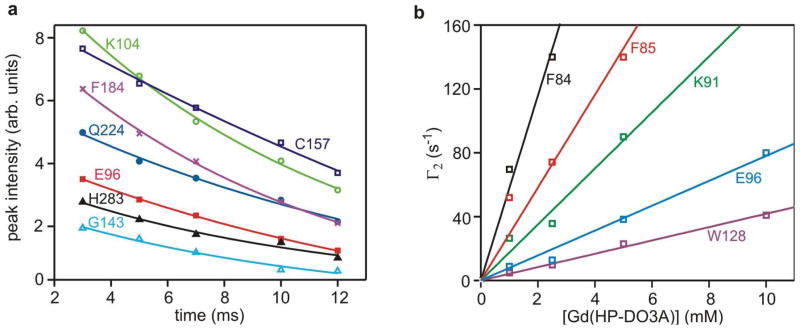
Figure 2.
Determination of amide proton transverse relaxation rates and molar relaxivities. (a) Exponential fits of the relaxation dispersion profiles of selected residues of the hUNG-DNA complex with [Gd(HP-DO3A)] = 10 mM. The nonlinear regression best-fit curves are shown. (b) Plot of Γ2 values obtained from eq 1 as a function of Gd(HP-DO3A) concentration for representative residues of free hUNG. The linear slope for each residue represents the spin-probe concentration-weighted PRE (Γ2′, or molar relaxivity).

