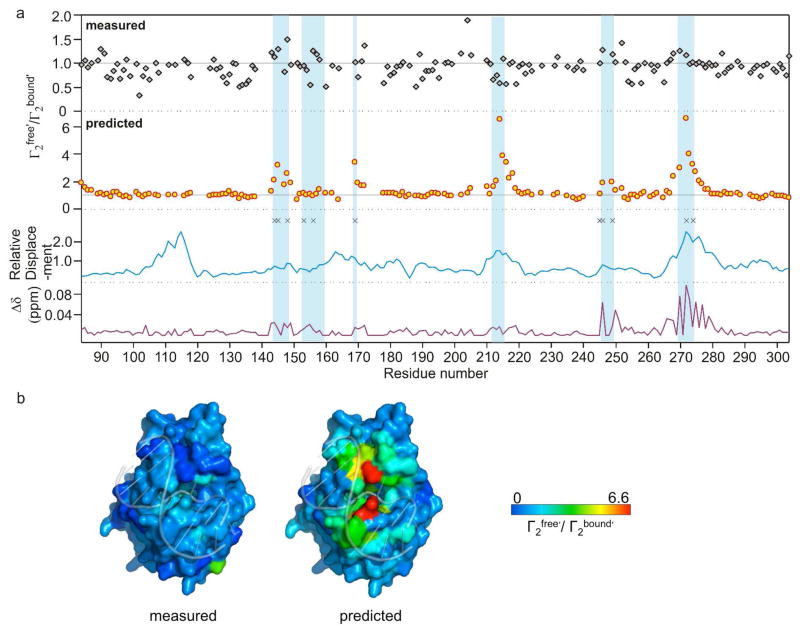
Figure 4.
Measured and predicted ratios of Γ2free′/Γ2bound′ across the hUNG linear sequence and comparison with dynamic properties, DNA induced chemical shift changes, and relative backbone amide nitrogen atom displacements obtained in a course-grain normal mode analysis. (a) From top to bottom: measured and predicted ratios of Γ2free′/Γ2bound′, amide nitrogen displacements in the lowest frequency normal mode analysis of free hUNG (1AKZ), and weighted chemical shift (1H and 15N) perturbations brought about by DNA binding. The black asterisks indicate amide positions with kex values in millisecond range (16). Vertical blue shaded bars indicate the six regions of the primary sequence that are important for DNA binding or enzyme catalytic activity. Supplementary Table S1 lists all of the PREs, chemical shift perturbations, relative atom displacements in the normal mode analysis, and residues with chemical exchange contributions to their linewidths. (b) Crystal structures of exosite hUNG-DNA complex (2OXM) with the measured (left) and predicted (right) Γ2free′/Γ2bound′ ratios color coded to the surface.

