
Figure 5.
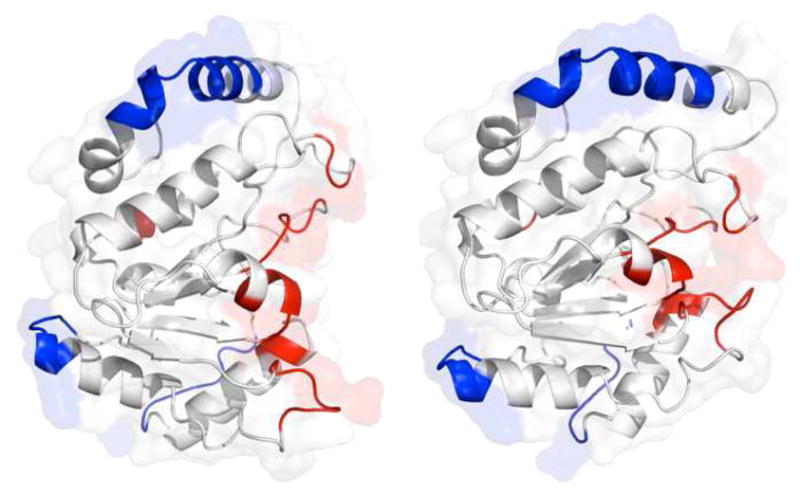
The two extrema of a course-grain normal mode analysis performed using the crystallographic coordinates of free hUNG (1AKZ). Sites that are hyper-reactive and protected from the paramagnetic probe are colored in red and blue, respectively. The left panel shows the open state and the right panel shows the closed conformation.