
Fig. 2. Four weeks of sunitinib therapy decreased immune suppression, followed by an immune suppressive rebound after treatment interruption.
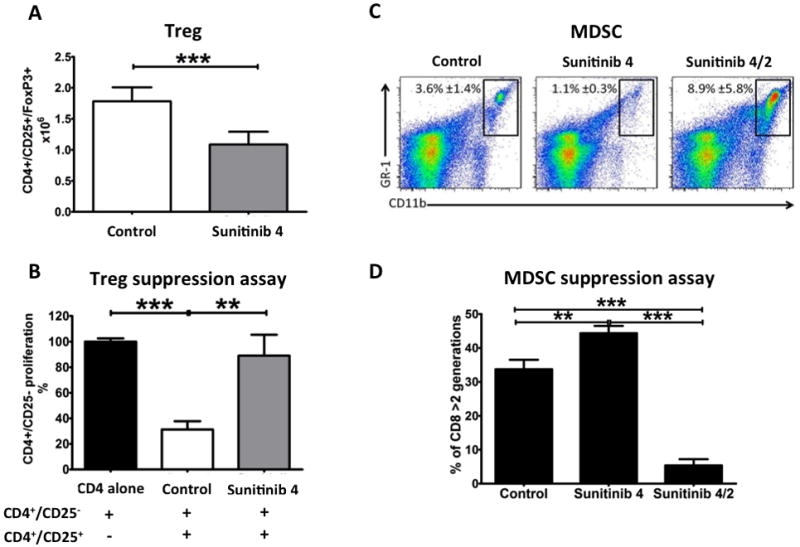
C57BL/6 mice (5/group) were treated with sunitinib corresponding to a human dose of 37.5–50 mg/day for 4 weeks, followed by 2 weeks of rest (sunitinib 4/2). Control: mice fed with control diet for 6 weeks; Sunitinib 4: mice fed with sunitinib diet for 4 weeks; Sunitinib 4/2: mice fed with sunitinib diet for 4 weeks, followed by 2 weeks of control diet. (A) Number of Treg lymphocytes in mouse spleens after 4 weeks of sunitinib or control diet. Statistical difference based on unpaired t-test compared to day 0. (B) Suppression assay of purified Tregs from mice treated for 4 weeks with sunitinib or control diet. Columns indicate proliferation of CD4+/CD25− fraction as measured by 3H release assay. Statistical difference based on one-way ANOVA test with Bonferroni’s multiple comparison tests. (C) Biparametric flow cytometric representation of MDSCs in mouse spleens. Squares indicate GR-1+/CD11b+ MDSCs, with percentage ± SD. (D) Three-day MDSC functional assay of purified CD11b+/GRhi plus CD11b+/GR1dim splenocytes (effectors) cocultured with CFSE-loaded CD8 lymphocytes from control-treated mice (targets). Proliferation was assessed by flow cytometric CFSE dilution assay. Columns represent percentage of CD8 lymphocytes undergone to 3 or more cell division cycle. Statistical difference based on one-way ANOVA test with Bonferroni’s multiple comparison tests. For A, B, and D bars represent SD. * = P < 0.050; ** = P < 0.005; *** = P < 0.001.