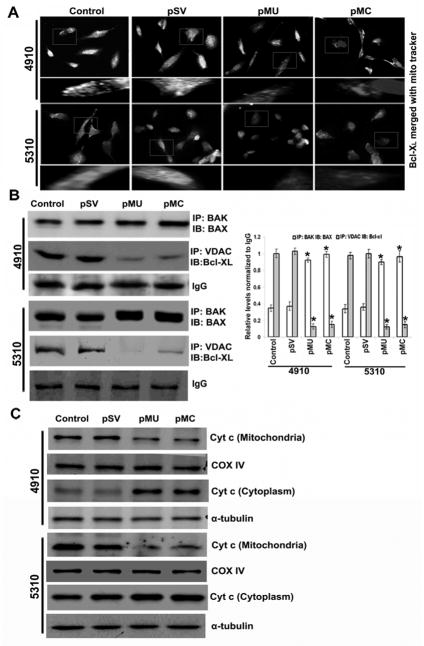
Figure 5. pMU and pMC induce mitochondrial cytochrome c release.
(A) Immunofluorescence analysis shows Bcl-XL binding to mitochondria (MitoTracker red stain). Interaction is shown as bright white spots. (B) Cell lysates were assessed for interaction between VDAC1 and Bcl-XL and BAX and BAK using immunoprecipitation. Densitometric analysis show interaction of BAX-BAK and VDAC- Bcl-XL. IgG showed equal loading. (C) Cells were harvested and lysed, and fractions of mitochondrial and cytosolic were collected separately. These fractions were assessed by Western blot analysis using anti-cytochrome c antibody. COX-IV and α-tubulin showed purity of mitochondrial and cytosolic fractions, respectively. Results are representative of three independent experiments (columns: mean of three experiments; bars: S.D.). *p<0.05, difference between control/pSV and pMU/pMC.

