
Figure 3.
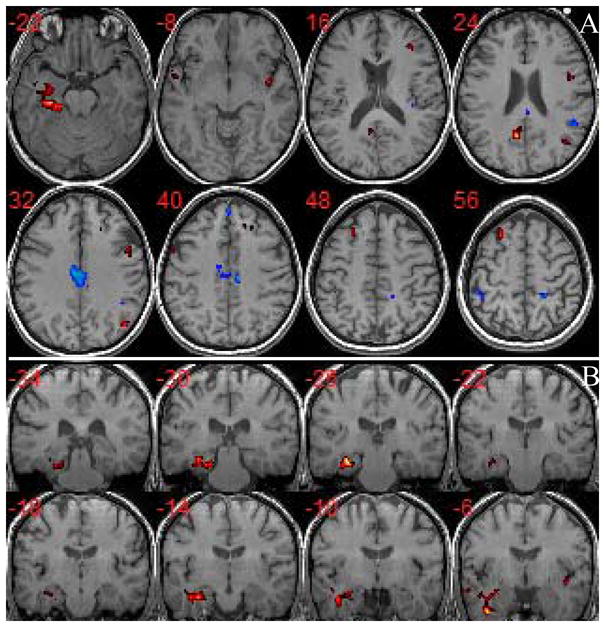
Group difference of DMN components between aMCI and normal controls (corrected p<0.05). (A) Axial view of major differences: hot red color represents decreased activities in aMCI (t score range is from 2.98 to 7.18) and cold blue color represents increased activities in aMCI (t score range is from 2.98 to 5.91); (B) Coronal view of the decreased activities in left MTL for aMCI from posterior to anterior slices. The aMCI subjects show decreased activities in left MTL, LPFC, PCC/retrosplenial cortex (RC)/Precuneus, left medial temporal gyrus (MTG), and right AG, while increased activities in MCC, MPFC, and left inferior parietal lobe (IPL).