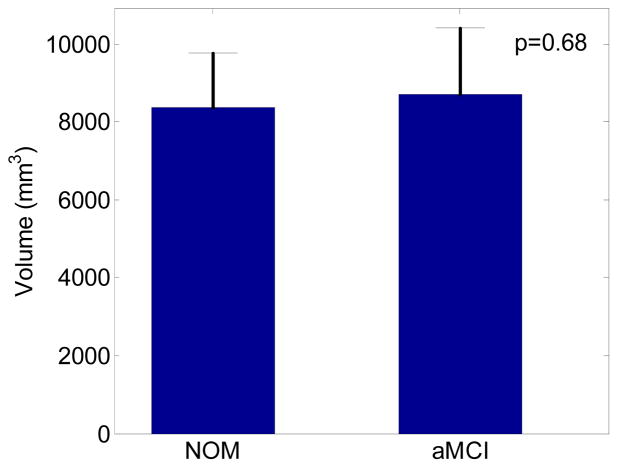
Figure 5.
The medial temporal lobe (MTL) volume comparison between age-matched normal controls (NOM) and aMCI. The MTL region including hippocampus, entorhinal cortex, perirhinal cortex, and parahippocampal gyrus was delineated slice-by-slice in each subject’s high resolution T2 image by a trained professional. The two-sample t-test on the MTL volumes of two groups were not statistically significant (p=0.68).

