Figure 3.
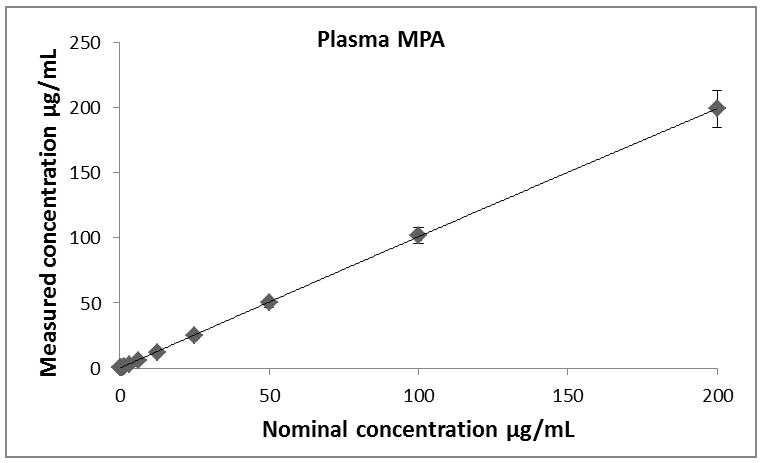
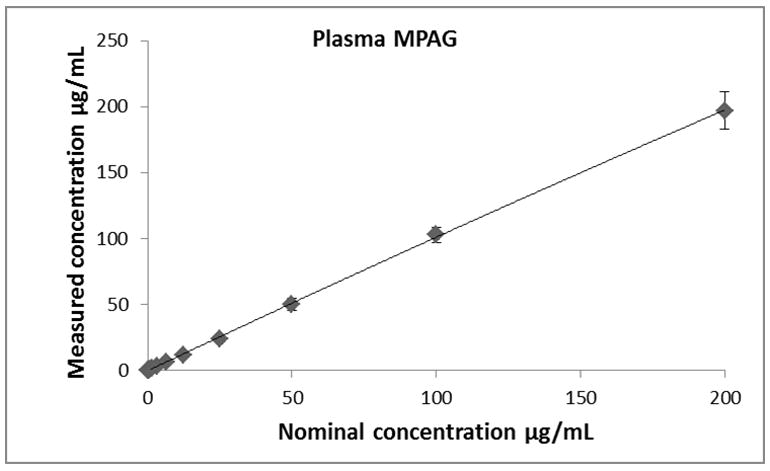
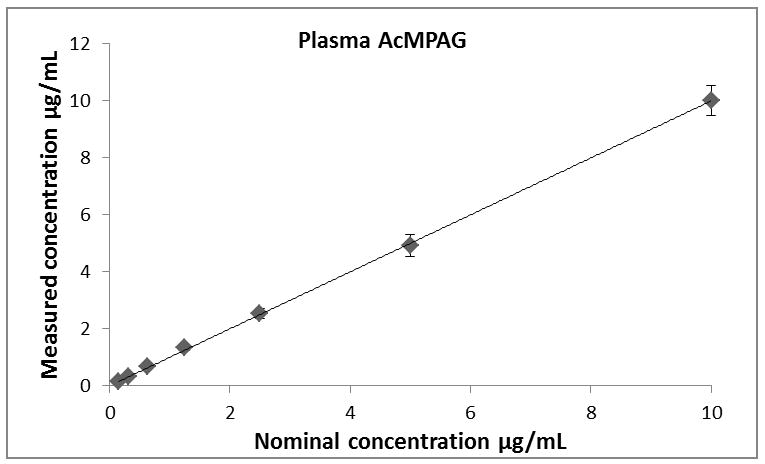
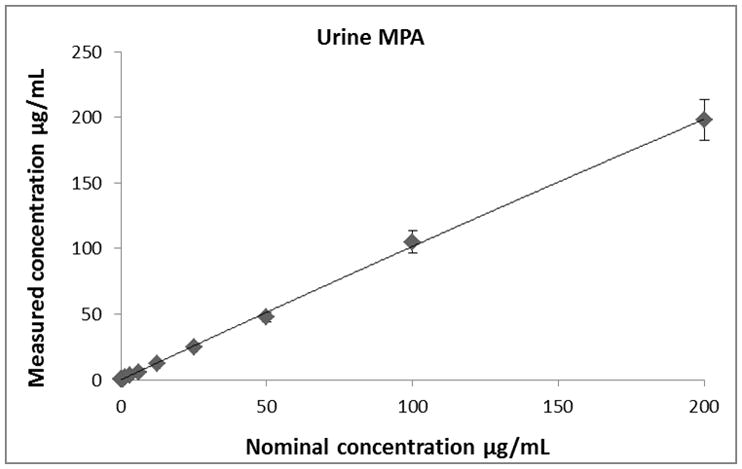
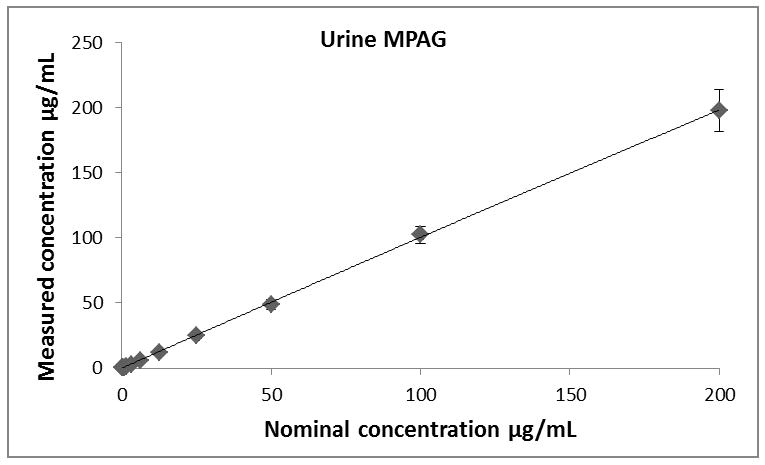
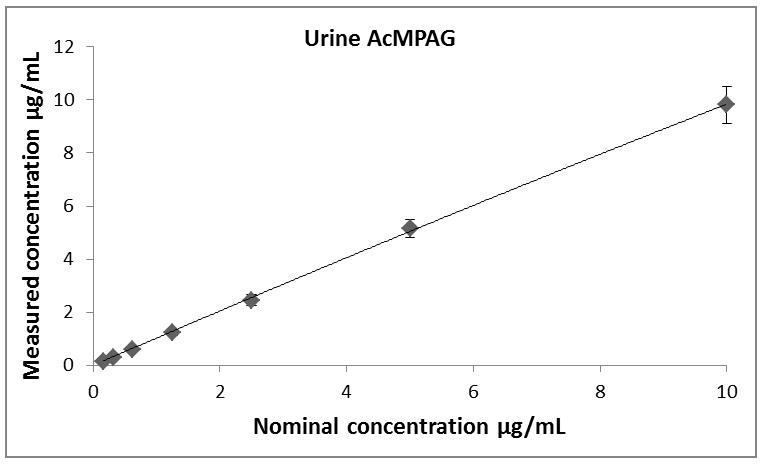
Descriptive statistics of calibration curves. Calibrations curves of MPA, MPAG and AcMPAG in plasma (A), (B), and (C) and urine (D), (E), and (F). Means ± standard errors are shown for calibration curves from three days of validation (n =6/day, n=18 total). Please note that some of the smaller error bars are hidden behind the symbols. Also, please see Table 1 for range of reliable response, curve fits and regression coefficients.
