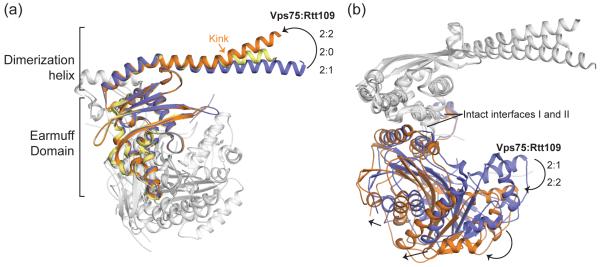
Figure 3. Conformational differences between Vps75-Rtt109 at a 2:1 and 2:2 stoichiometry.
Cartoon superposition (via a single Vps75 chain) of Vps75 alone (PDB 3DM7 chain a – yellow) and Rtt109-Vps75 (PDB 3Q66 chains a and c – blue and 3Q33 – orange). (a) Compared to free Vps75, the Vps75 dimerization helix is kinked in the 2:2 complex and arcs downwards in the 2:1 complex. Rtt109 chains are shown in white. (b) Rtt109 is shifted ‘outward’ in the 2:2 complex compared to the 2:1 complex. Arrows indicate example secondary structure shifts, and Vps75 chains are shown in white. Interface I and II remain intact.

