
Fig. 6.
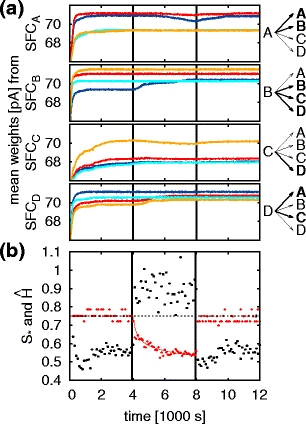
Gradual loss of syntax with imprinted transitions. (a) Left panel: average synaptic weights for the feed-forward connections from the final pool of each synfire chain (SFCA-SFCD) to the initial pools of all chains (SFCA, blue; SFCB, red; SFCC, cyan; SFCD, yellow). The auditory feedback is suppressed at t
df = 4,000 s and restored at 8,000 s (vertical black lines). Right panel: connections that are potentiated before auditory feedback is suppressed are highlighted by broader arrows and bold letters. (b) Sequencing stereotype (S
⋆ , red dots) and average transition entropy (