Fig. 1.

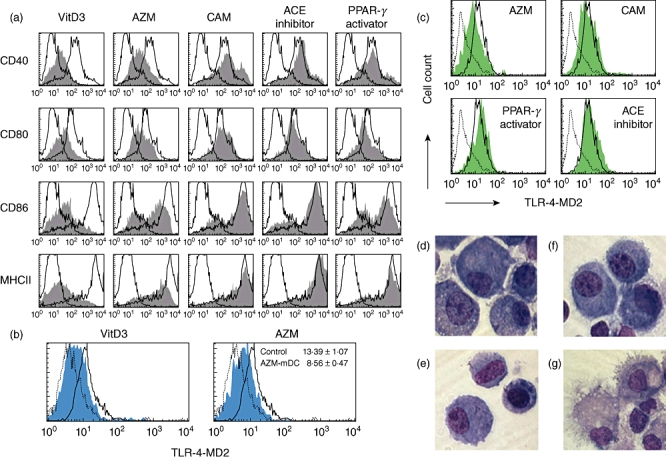
Azithromycin inhibits dendritic cell (DC) maturation. Bone marrow (BM)-derived DCs were generated as described in Materials and methods [using a nuclear factor kappa B (NF-κB) inhibitor at the indicated concentrations and times]. On day 6, maturation was induced by incubation of immature DCs (im-DCs) with lipopolysaccharide (LPS) (a,d–g) or tumour necrosis factor (TNF)-α (b and c). (a–c) Flow cytometric analysis of the expression of the indicated surface molecules on mature DCs (m-DCs). Propidium iodide-negative cells were gated on CD11c+. The staining profiles of control m-DCs (thin line) and NF-κB inhibitor-treated m-DCs (grey) for the indicated surface molecules are shown. Dotted lines indicate isotype controls. We used five kinds of NF-κB inhibitors: 1, 25-dihydroxyvitamin D3 (Vit. D3), used as a positive control in suppression of DC maturation; an angiotensin-converting enzyme (ACE) inhibitor; a peroxisome proliferator-activated receptor-γ (PPAR-γ) activator; clarithromycin (CAM); and azithromycin (AZM). (a) Comparative study of the expression of major histocompatibility complex (MHC) class II CD40, CD80 and CD86 on m-DCs exposed to NF-κB inhibitors. AZM was added to culture wells at 50 µg/ml on days 0, 3 and 6. (b) The expression of Toll-like receptor-4 (TLR-4)-message digest 2 (MD2) on TNF-α-induced m-DCs treated with AZM 50 (days 0, 3, 6) was detected by flow cytometry in comparison with control m-DCs. The mean fluorescence intensity is shown in the upper right corner of the plot. (c) Expression of TLR-4-MD2 on TNF-α-induced m-DCs treated with ACE inhibitor, PPAR-γ activator or CAM was analysed by flow cytometry in comparison with control m-DCs. (d–g) AZM 50-treated (days 0, 3, 6) or untreated DCs were analysed morphologically in cytospin preparations after May–Giemsa staining (original magnification: × 1000). AZM-treated im-DCs (d), control im-DCs (e), AZM-treated m-DCs (f) and control m-DCs (g) are shown. All results are representative of three independent experiments.
