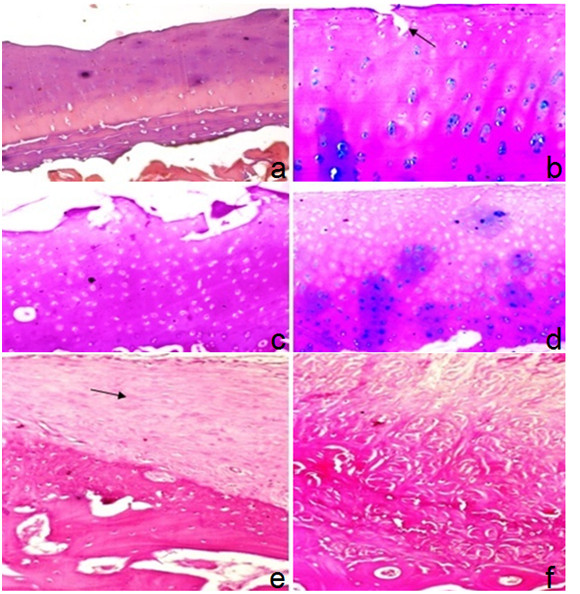
Figure 13.

Articular cartilage of group-III one month post injection: (a) control joint showing surface irregularity with hypocellularity and marked multiple tide marks (H&E 100x); (b) MSCs- treated joint showing degenerative changes with irregular surface, erosion (arrow) and hypocellularity in superficial zone and regenerative changes in middle zone & lower zone denoted by increased matrix synthesis, slight hypercellularity and chondrocytes clones (Alcian blue-PAS 100x). Articular cartilage of group-III two months post injection: (c) control joint showing surface erosion of articular cartilage with superficial loss of chondrocytes and moderate hypercellularity of rest of cartilage (H&E 100x); (d) MSCs-treated joint showing degenerative changes in the form of irregular surface, hypocellularity in superficial & middle zone and regenerative changes in lower zone denoted by hypercellularity& increased matrix synthesis (Alcian blue-PAS 100x). Articular cartilage of group-III six months post injection: (e) control joint showing articular cartilage destruction, pannus formation (arrow) and marked subchondral plate thickening (H&E 100x); (f) MSCs-treated joint showing articular cartilage destruction, fibrous tissue, scattered atrophic chondrocytes and marked subchondral plate thickening (H&E 100x).
