
Figure 7.
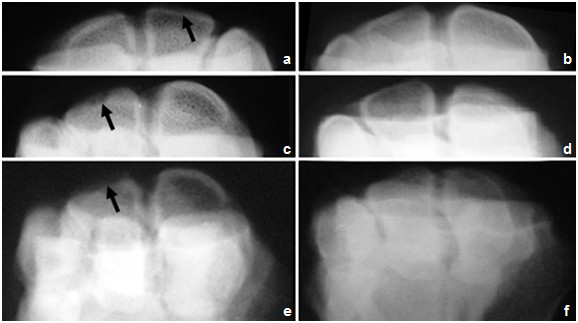
Flexed radiographic image of the carpal joint of group-III, showing the cartilage at (a) 1 month, (b) 2 month and (c) 6 month post injection of Amphotericin-B . Notice the thining of the articular cartilage compared to treated carpal joints -images on the right- at (d) 1 month, (e) 2 month and (f) 6 month post treatment with MSCs. Compare arrow with its contralateral.