Fig. 3.
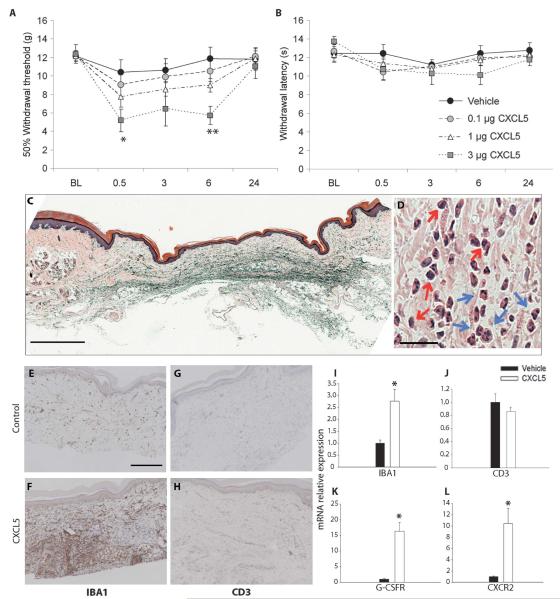
The chemokine CXCL5 causes mechanical pain-related hypersensitivity and induces an infiltration of neutrophils and macrophages. (A) When compared to control rats, intraplantar injection of CXCL5 (3 μg) produced a significant reduction in paw withdrawal thresholds to mechanical stimulation at 0.5 and 6 hours after treatment. No significant changes were measured in mechanical thresholds at doses of 0.1 and 1 μg. (B) In the same animals, no change was observed in withdrawal latencies to thermal stimulation at any dose [**P < 0.001; *P < 0.05, two-way repeated-measures analysis of variance (ANOVA); vehicle, 0.1 μg, 1 μg (n = 11), and 3 μg (n = 6)].(C and D) Plantar skin preparations stained with H&E showed a marked inflammatory cell infiltrate within the dermis 6 hours after intraplantar injection of CXCL5 (3 μg). A representative section at low magnification is shown in (C) (scale bar, 200 μm). In (D), a high-magnification section is shown (scale bar, 25 μm) and infiltrating cells, both monocytes (red arrows) and PMNs (blue arrows), are indicated. (E and F) A low level of macrophages (as shown by IBA1 staining) is seen in the dermis of control animals (E), which markedly increases at 6 hours after CXCL5 (3 μg) injections (F) (scale bar, 200 μm). (I) The increase in IBA1 expression after CXCL5 injections was confirmed with qPCR compared to mRNA expression in vehicle-treated skin. (G and H) Immunopositive CD3 cells (a marker of lymphocytes) were detected at low levels in control skin (G) and did not change after CXCL5 treatment (H). (J) There was no difference in the mRNA levels of CD3 in treated versus control animals. (K and L) The mRNA of the neutrophil marker G-CSFR (K) and the cognate receptor for CXCL5, CXCR2 (L), were significantly up-regulated in the chemokine-treated skin compared to control [*P < 0.05; **P < 0.01, Mann-Whitney rank sum test or t test (depending on data distribution); n = 3 to 5]. All data are presented as means ± SEM.

