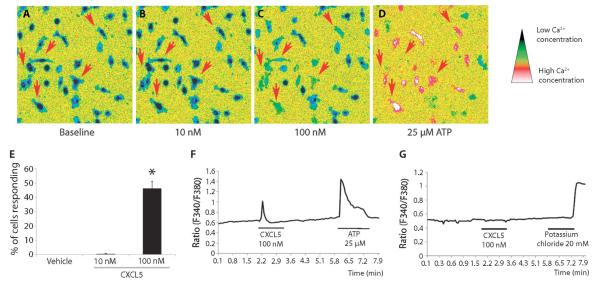
Fig. 6.
Exposure of macrophages to CXCL5 produced an increase in intracellular Ca2+ concentration ([Ca2+]i). (A to D) Macrophages in which application of ATP (25 μM) produced a change in [Ca2+]i [as seen in (D)] were included in the analysis (thus excluding dead or nonfunctional cells). CXCL5 at a dose of 100 nM increased [Ca2+]i in a number of cells as indicated by the red arrows (C). (E) The percentage of cells responding to 100 nM CXCL5 was significantly larger than after vehicle treatment (E) (Kruskal-Wallis one-way ANOVA on ranks, n = 3 to 6 independent experiments with at least 100 cells per concentration, data are presented as mean% ± SEM). (F and G) Representative response traces of a single cell for macrophages (F) and DRG neurons (G).

