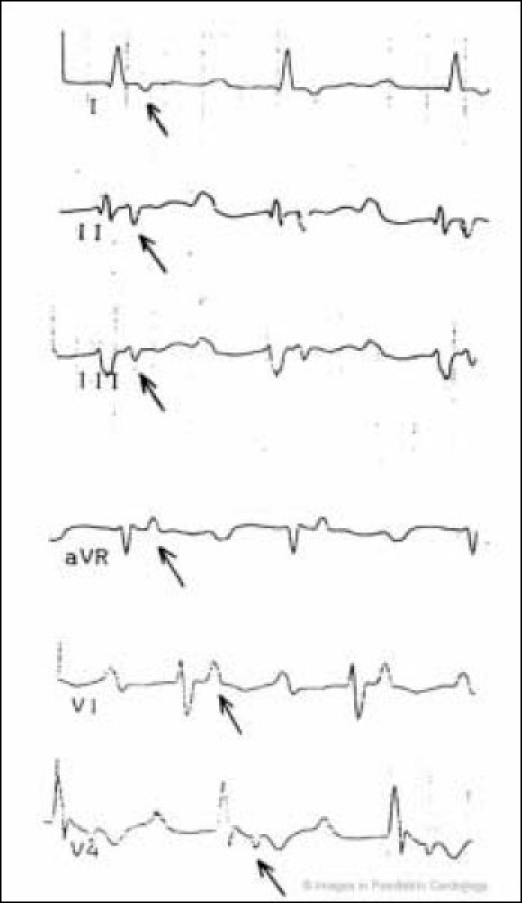
Figure 3.

A 48-year old man with a severe form of ARVC. Epsilon wave (arrow) simulates atrial tachycardia in leads I, II, III, aVR, V1 and V4. The epsilon wave is different from P axis. Right atrial enlargement, increased PR segment, low voltage of QRS, negative T-wave from V1-V6 are also present (modified from Nava et al4)
