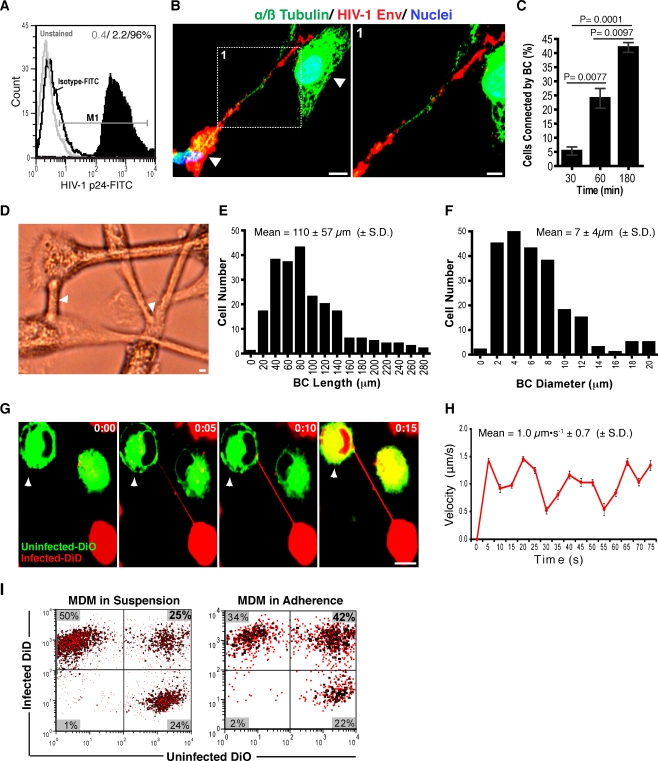
Fig. 1.
BC sustain communication between uninfected and infected MDM. a Assessment by flow cytometry of HIV-1 infection in single culture MDM. b Formation of BC between infected and uninfected MDM labeled for HIV-1 envelope (red) and microtubules (green). Observe presence of HIV-1 Env along the conduit (scale bars, 10 μm, inset, 5 μm). c Frequency of BC formation in MDM uninfected, infected and mixed cultures (equal ratios of uninfected and infected MDM) at 30, 60 and 180 min in adherence (n = 450 cells/group, error bars ± S.E.M). Data are representative of five independent experiments. d Bright field images of conduits connecting MDM in mixed culture. Arrows indicate tethering sites (scale bar, 10 μm). e, f Frequency of conduit length and diameter observed in MDM mixed populations (n = 238 cells). g Time-lapse confocal images showing contact establishment and lipid transfer through BC from infected (DiD-labeled, red) to uninfected (DiO-labeled, green) MDM. h Velocity of lipid transfer through the BC. Graph reflects average velocity values recorded at each time point for 80 particles tracked along the BC (error bars ± S.E.M.). i Intercellular transfer activity in mixed MDM in presence (adherent cultures) and absence (suspension cultures) of conduits. Ratios of cells affected by this process over time (yellow, upper right quadrants) compared to the overall red (DiD-labeled infected MDM, upper left quadrants) and green populations (DiO-labeled, uninfected MDM, lower right quadrants) are shown in bold

