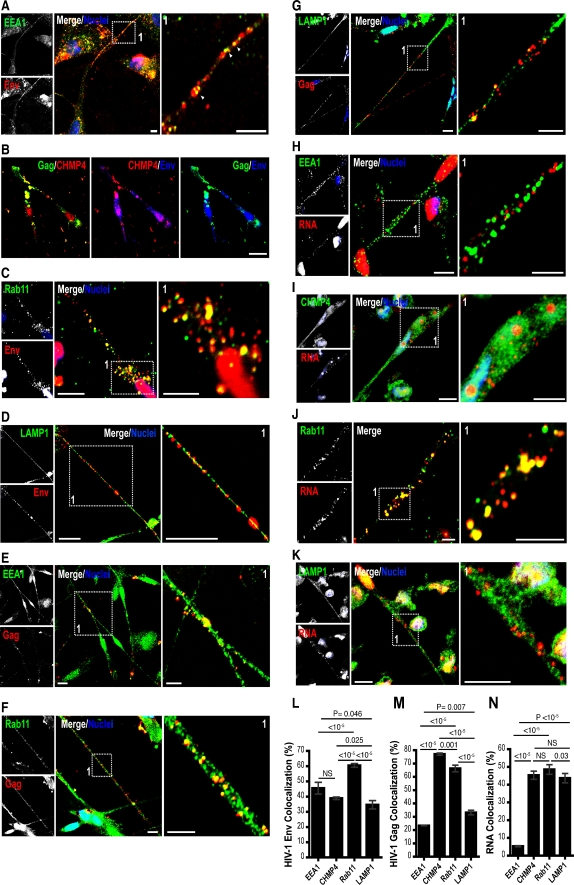
Fig. 4.
Distribution of HIV-1 constituents with BC endocytic compartments. a–k Confocal images of MDM in mixed culture showing distribution of HIV-1 Env (red, panels a, c, d and blue, b), Gag (green, b and red, e–g), metabolically labeled RNA (red) with early endosomes (green), MVB (green), recycling endosomes (green), and lysosomes (green) identified in the conduits (scale bars, 10 μm; insets, 5 μm). l–n, Pearson’s colocalization tests of HIV-1 Env, Gag and RNA distribution with BC endocytic compartments. Pearson’s colocalization coefficients were converted to percent overlap between fluorophores (error bars ± S.E.M., n = 80 cells)

