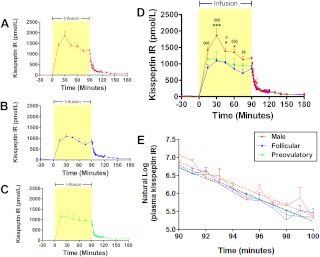
Fig. 5.
Detailed time profiles of plasma kisspeptin IR after iv infusion of kisspeptin-10 to healthy male and female volunteers. A–D, Blood sampling was performed for measurement of plasma kisspeptin IR during 4 h after commencement of a 90-min iv infusion of kisspeptin-10 (360 pmol/kg · min) to healthy male volunteers (A and D) and female volunteers during the follicular (B and D) and preovulatory (C and D) phases of the menstrual cycle (n = 4–5 per group). For men vs. women during follicular phase: φφφ, P < 0.001; φ, P < 0.05. For men vs. women during preovulatory phase: ***, P < 0.001; *, P < 0.05. E, Blood sampling was performed at 1-min intervals immediately after stopping infusion of kisspeptin-10. Linear curve fits of natural log plasma kisspeptin IR (dotted lines) were similar for all three groups (P = 0.91). Data are shown as mean ± sem.

