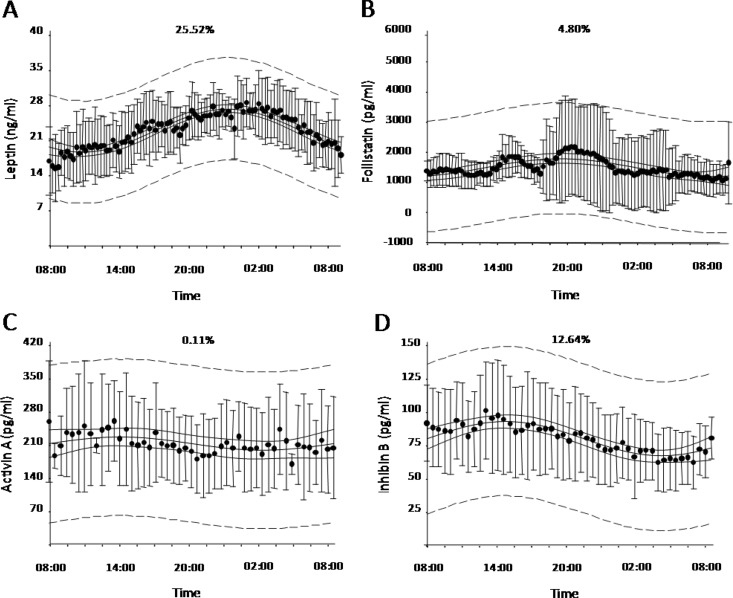
Fig. 1.
Average 24-h (0800–0800 h) leptin (n = 6) (A), FST (n = 6) (B), activin A (n = 6) (C), and inhibin B (n = 9) (D) levels on d 3 of baseline fed state (nonlinear adjusted R2 is displayed on top center of each panel; dashed lines represent 95% prediction band; solid lines represent 95% confidence bands).

