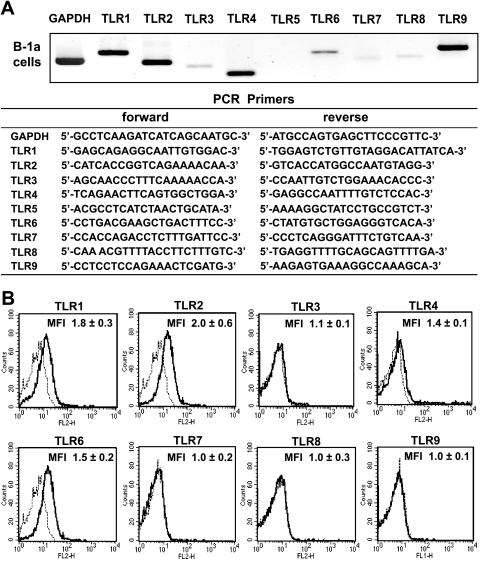
Fig. 6.
TLR expression on murine B-1 cells. (A) TLR expression in B-1a cells was analyzed by reverse transcription-PCR. B-1a cells strongly expressed TLR1, TLR2, TLR4, TLR6, and TLR9 and weakly expressed TLR3, TLR7, and TLR8. (B) Surface expression of TLRs on purified B-1a cells was also analyzed by flow cytometry. B-1a cells expressed TLR1, TLR2, TLR4, and TLR6 on their surface. MFI, maximum fluorescence intensity.

