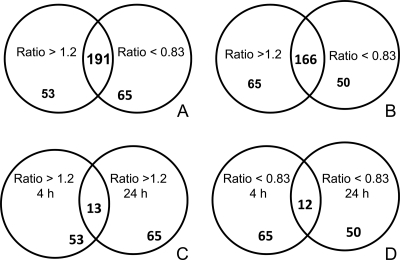
Fig. 2.
IL-10 alters the gene expression pattern induced by live B. burgdorferi spirochetes in macrophages. Diagrams of the 191 (4 h) and 166 (24 h) overlapping genes (Fig. 1) that were induced by live spirochetes and whose expression levels were inhibited by IL-10 (ratio of ≥1.2) and genes that were induced by live spirochetes and whose expression levels were potentiated by IL-10 (ratio of ≤0.83) are shown for the 4-h (A) and 24-h (B) time points. The common IL-10-inhibited genes between the 4-h and 24-h (C) and the common IL-10-potentiated genes between the 4-h and 24-h (D) time points are also represented.

