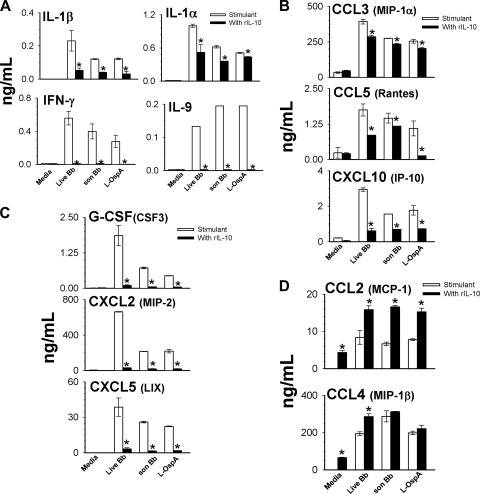
Fig. 4.
IL-10-mediated regulation of cytokine (A) and chemokine (B to D) production by macrophages exposed in vitro to live or sonicated B. burgdorferi spirochetes or with L-OspA. Macrophages (3 × 10⁶/ml) were stimulated as described in the legend of Fig. 3. Cell-free supernatants were harvested from cultures at 24 h, and protein determinations were made by multiplex ELISA. The lower limit of detection of the multiplex ELISA was 3.2 pg/ml. Cytokine and chemokine production levels are shown in ng/ml. Asterisks indicate significant differences from cells incubated with stimulants alone (P < 0.05 to P < 0.0000001). P values were calculated by use of an unpaired Student's t test. Each bar represents the mean ± SD of duplicate cultures.

