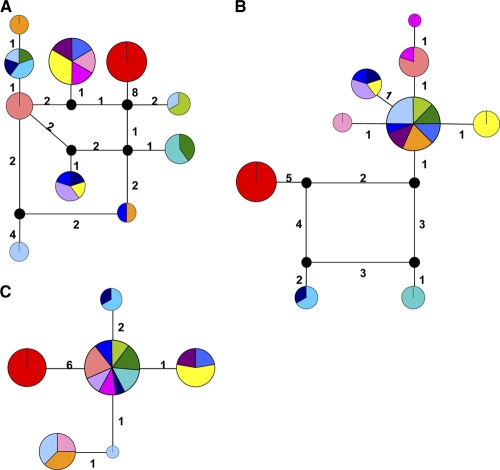
Fig. 2.
Genealogical relationships among alleles recovered from the Necker collection for representative loci: ppsA (A), trpE (B), and nuoD (C). The area of the node is proportional to the relative frequency of the allele in the sample, and the wedge color corresponds to the series color depicted in Fig. 1 and in Fig. S1 in ths supplemental material. The sum of the branch lengths between two alleles corresponds exactly to the number of nucleotide sequence differences observed between them. Note the presence of cycles for loci impacted by recombination. Black nodes represent alleles not observed in the sample.

