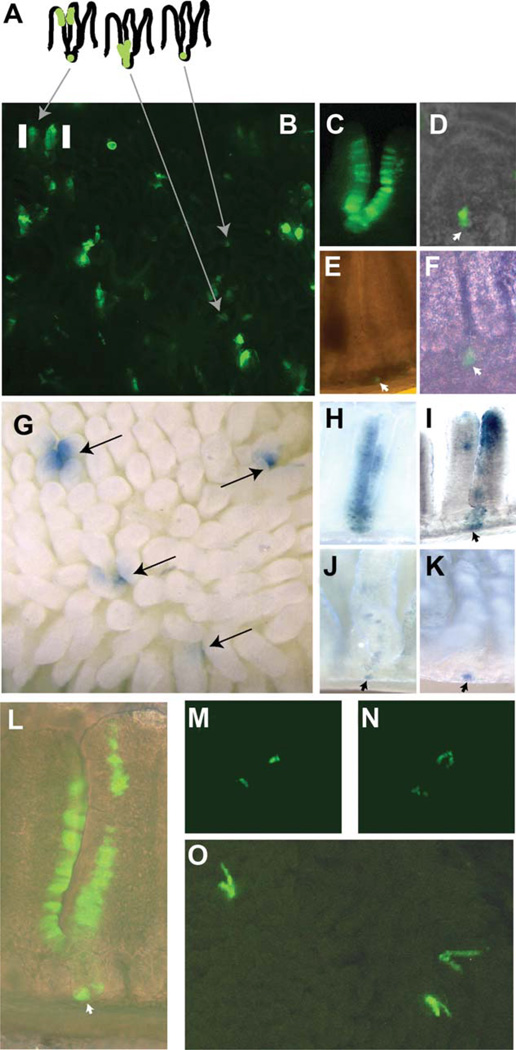
Figure 1.
Mcm2-CreERT2-induced reporter expression profiles in small intestine. The schematic in panel (A) represents an interpretation of various enhanced green fluorescent protein (EGFP)-marked clusters of cells in panel (B) which is an image of EGFP fluorescence in a living explant of the small intestine of an Mcm2Cre-ERT2;Tg(ACTB-Bgeo/GFP)21Lbe (commonly referred to as Z/EG) mouse at approximately 1 month following treatment with tamoxifen. Panels (C–F) are images of EGFP expressing cells in individual crypts and associated villi at between 1 and 3 months following tamoxifen treatment and prepared by mild formalin fixation and manual dissection. Panel (G) is an image of the small intestine from an Mcm2Cre-ERT2;R26R mouse at approximately 10 weeks following tamoxifen treatment and stained for β-galactosidase activity. Panels (H–K) show images of β-galactosidase stained cells in individual crypts and associated villi following manual dissection. Panel (L) shows a manually dissected crypt containing EGFP expressing cells at 10 months following tamoxifen treatment. Panels (M, N) show regions of EGFP expression in living explants immediately following isolation [panel (M)] or after 12 hours in culture [panel (N)] where the same location is shown. Panel (O) is an image of the small intestine of an Mcm2Cre-ERT2;Z/EG mouse at approximately 1 month following treatment with tamoxifen where during the final 3 days prior to isolation the mouse received daily injections of insulin-like growth factor 1 (IGF1). The images in panels (B, C, E, M, N, O) were taken using a fluorescence dissecting stereomicroscope at magnifications between ×20 and ×40. The images in panels (G–K) were taken using a dissecting stereomicroscope and bright-field illumination at magnifications between ×20 and ×40. The images in panels (D, F, L) were taken using an inverted fluorescence microscope at magnifications ranging between ×40 and ×200. Additional images of the crypt shown in panel (D) are presented in the Supporting Information, Section 1, Figure S2.

