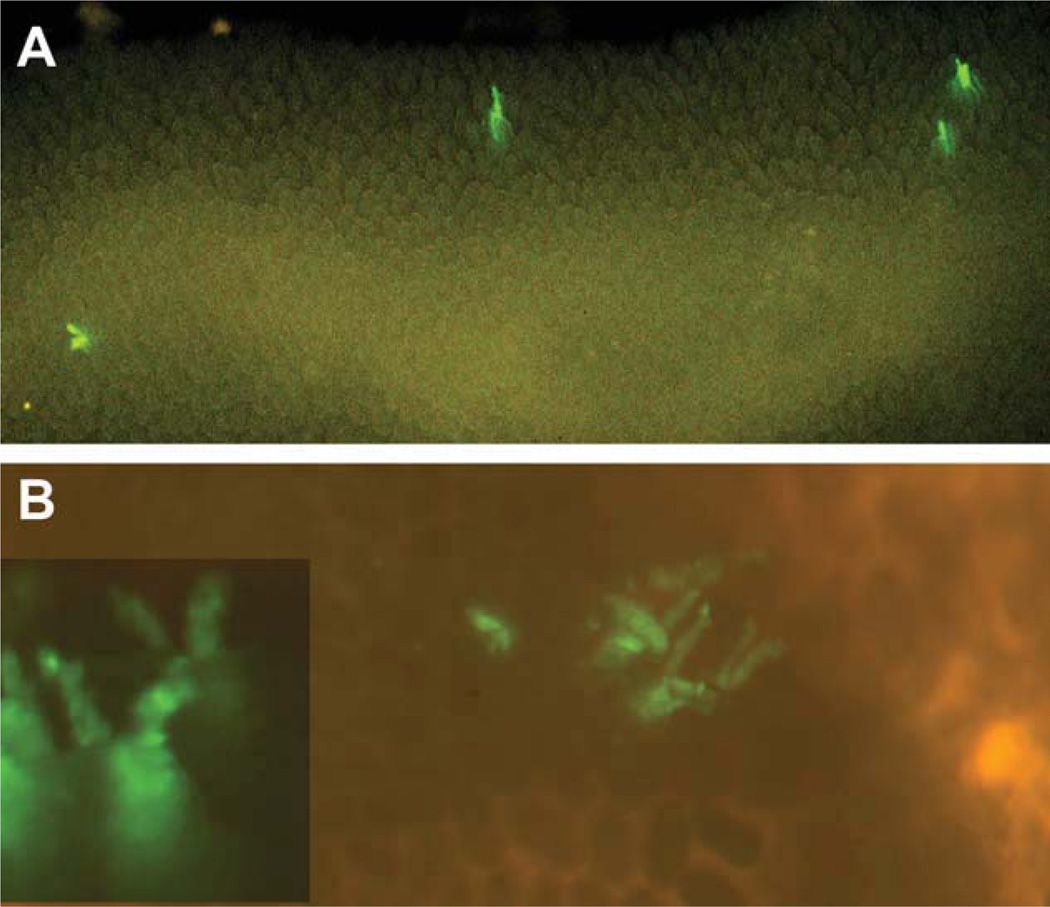
Figure 5.
EGFP expression profiles in small intestine of Mcm2-CreERT2:Z/EG mice at approximately 10 months following tamoxifen treatment. Panel (A) is an image taken using a fluorescence dissecting microscope at approximately ×20 magnification of EGFP fluorescence in scattered individual crypts of living explant from the small intestine of an Mcm2Cre-ERT2;Z/EG mouse at approximately 10 months following treatment with tamoxifen. Panel (B) shows an image taken at approximately ×30 magnification of clusters of EGFP fluorescence-marked crypts which are also found in these mice at approximately 10 months following tamoxifen treatment, where the inset in this figure is a higher magnification of a similar cluster.

