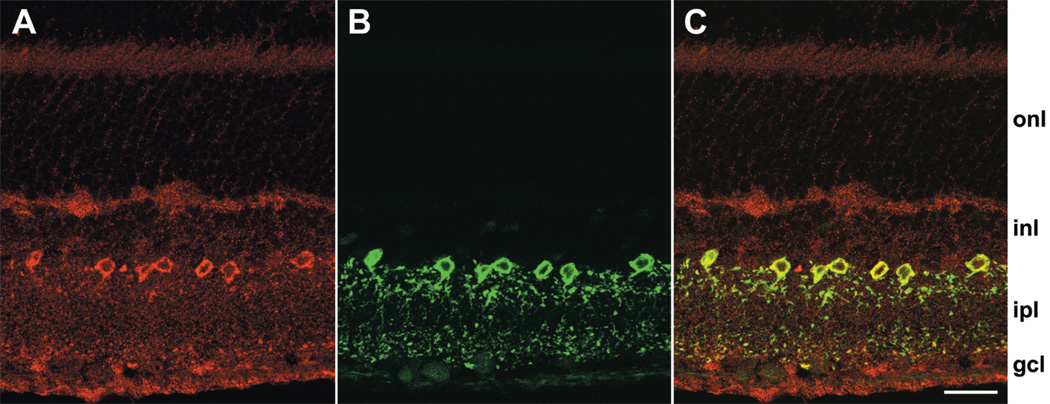
Figure 4.
Colocalization of parvalbumin and DARPP-32 in vertical sections. (A) Labeling with anti-DARPP-32 antibody visualized with cy3-conjugated anti-rabbit IgG. Confocal images were obtained at 0.20 µm z intervals with 3-frame Kalman averaging on the Bio-Rad Radiance 2100. This image is the result of a maximum intensity z-projection of 6 consecutive optical sections. (B) Labeling with anti-parvalbumin antibody visualized with Alexa Fluor 488-conjugated anti-mouse IgG. These data were obtained concurrently with the anti-DARPP-32 images in panel A using Sequential acquisition mode, in which fluorescence due to each dye is obtained individually. (C) Direct overlay of panels A and B. Yellow indicates regions of overlapping red and green signal. Position of retinal layers indicated as in Figure 3. Scale bar is 20 µm.

