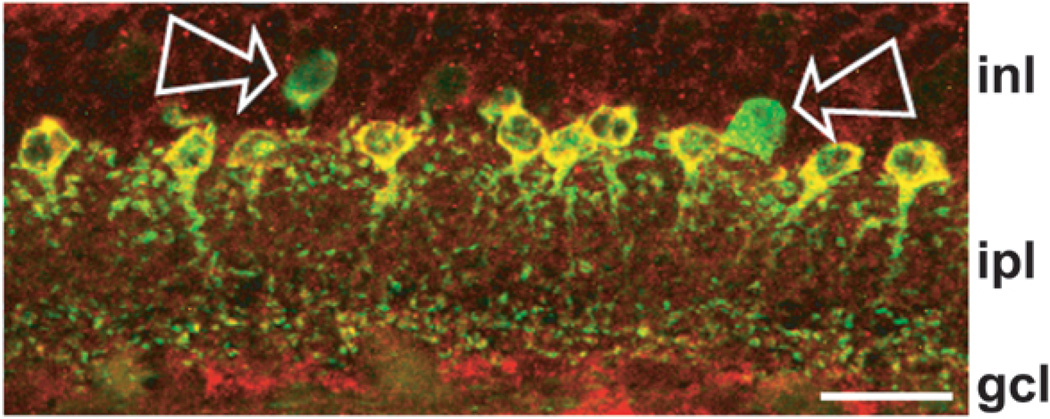
Figure 5.
Parvalbumin, without detectable DARPP-32, in some cells in vertical sections. Direct overlay of PV and DARPP-32 immunolabeling of a field imaged as in Figure 4, except that DARPP-32 was visualized with Alexa Fluor 594-conjugated secondary and the image is a z-projection of 5 optical sections obtained at 0.30 µm z intervals with 2-frame Kalman averaging. Yellow indicates regions of overlapping red and green signal. Arrows show two cells that were PV positive and DARPP-32 negative. Note that one of these fluoresced weakly (left arrow), while the other fluoresced brightly (right arrow). Position of retinal layers indicated as in Figure 4. Scale bar is 20 µm.

