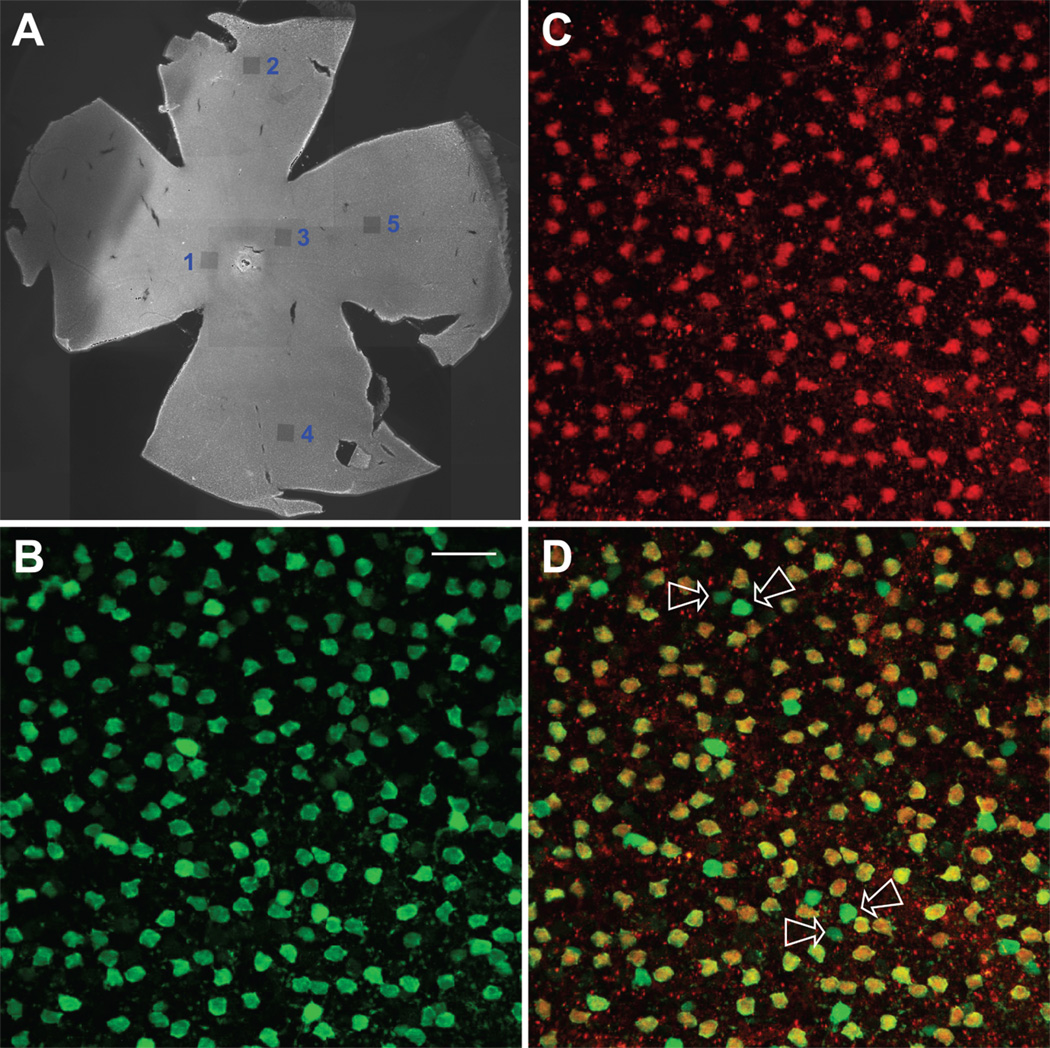
Figure 6.
Colocalization of parvalbumin and DARPP-32 in whole retina. (A) Epi-fluorescence low-magnification image of an entire flattened retina. This tissue was probed with anti-PV and anti-DARPP-32 antibodies and counterstained with Alexa Fluor 488 for PV and Alexa Fluor 555 for DARPP-32. The small, darkened squares, numbered 1–5, are areas that were imaged at higher magnification on the Bio-Rad Radiance 2100 and then deliberately bleached by exposure to the Ar 488 laser line at full power. The optic nerve head is whitish in this image, and can be seen part way between the areas numbered 1 and 3. The false-color fluorescent images in B–D were taken from the area labeled “1”, which was in the dorsal-temporal region of this retina. (B) PV-positive cells. Confocal images obtained at 0.30 µm z intervals with 2-frame Kalman averaging. This is a maximum intensity z-projection of 9 consecutive optical sections. (C) DARPP-32-positive cells. Same conditions as panel B. (D) Overlay of panels B and C. Yellow indicates regions of overlapping red and green signal. Arrows show some of the cells that were PV positive and DARPP-32 negative. Note that, between each pair of arrows, one of these fluoresced weakly, while the other fluoresced brightly. Scale bar is 25 µm.

